Tableau and Power BI are some of the leading business intelligence software in the market that allows organizations to analyze data and provide insightful visualization for making better decisions and policies. When comparing Tableau vs Power BI, it becomes clear that while both aim to simplify complex data and empower decision-making, they differ in features, strengths, and ideal applications. With the advanced visualization capabilities, both solutions have become highly popular, and they cater to two different audiences. Power BI was a product developed by Microsoft to help integrate well with other products from the same company. It received recognition for its cost-effectiveness and excellent user-friendliness. Tableau, therefore, is recognized for flexibility, as it provides huge customization options and is suitable for handling big data. Power BI and Tableau are chosen depending on what an organization requires, the ideal budget, and the depth of analytical value, making Tableau and Power BI comparisons essential.
What is Tableau?
Tableau is one of the leading business intelligence and data visualization tools, which helps make the task of exploring and analyzing data much more manageable. It is a tool that enables users to transform raw data into interactive, shareable dashboards and reports. Characterized by an intuitive drag-and-drop interface and advanced visualization capabilities, Tableau empowers users to gain deep insights and make data-driven decisions without extensive technical expertise.
Founded in 2003 by Christian Chabot, Pat Hanrahan, and Chris Stolte in Mountain View, California, Tableau was based on the idea born from the research conducted at Stanford University in visualizing structured data. Its first product, Tableau Desktop, was released in 2004 and gained immediate popularity for its user-friendly interface and powerful analytics capabilities. In 2019, Salesforce acquired Tableau for $15.7 billion, further expanding its reach and integration capabilities within the Salesforce ecosystem. Today, Tableau remains one of the most widely used BI tools worldwide. Tableau's products are shown in the figure below.
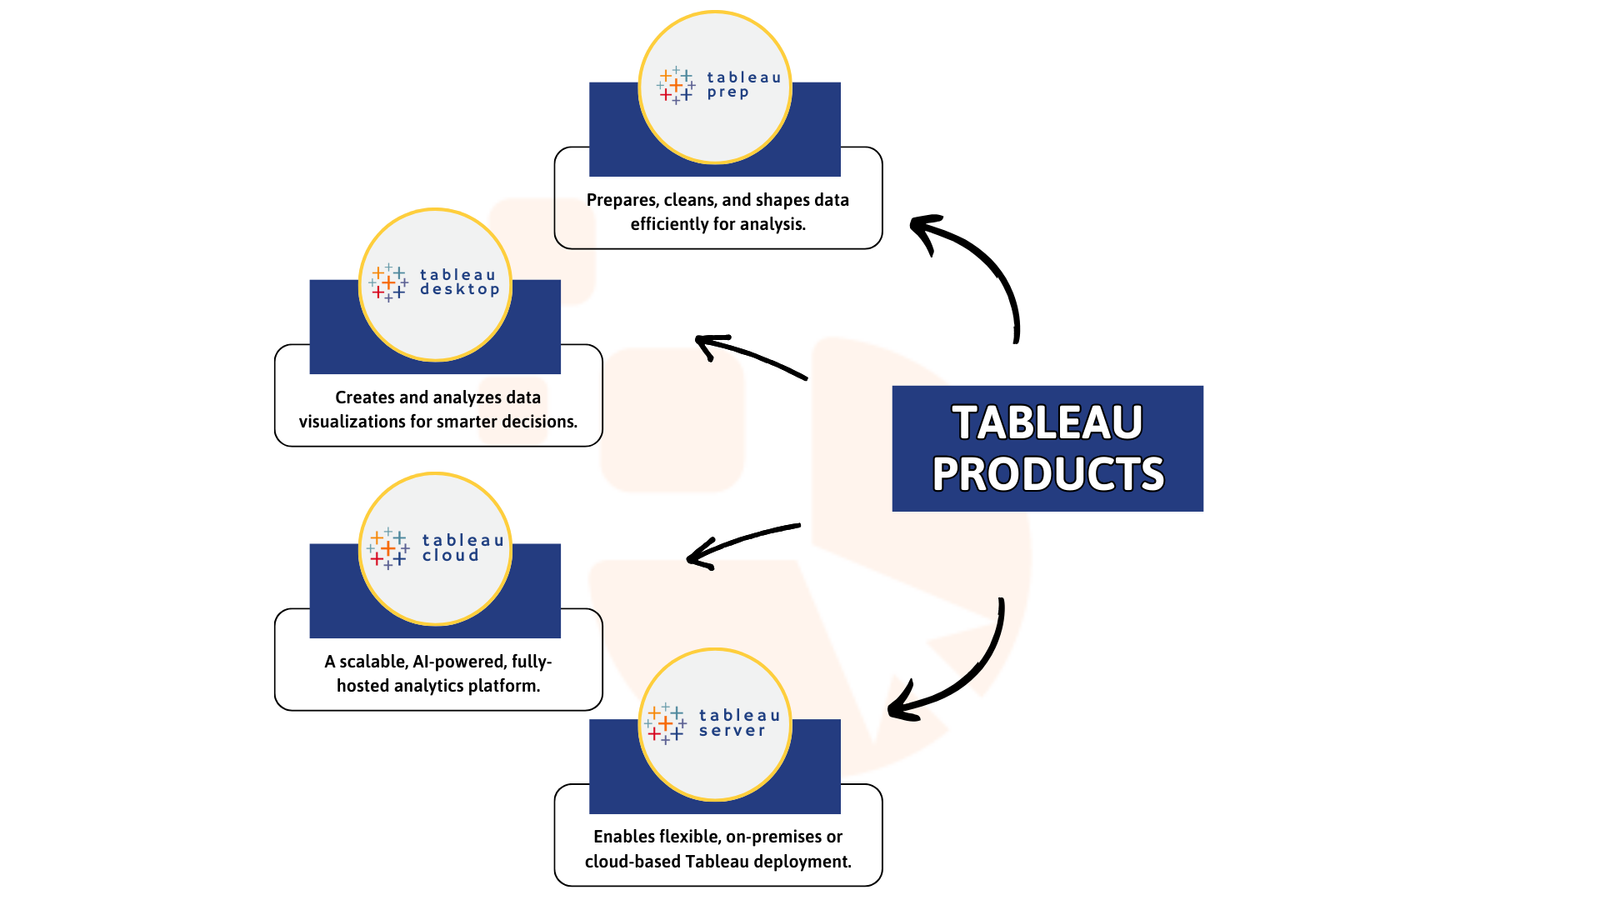
Figure shows the Products identified from Tableau.
Features of Tableau
1. Interactive Visualizations: Tableau provides interactive visualizations including scatter plots, heat maps, and geographic maps, among others. For instance, a marketing manager could use an interactive map to visualize superstore sales across regions.
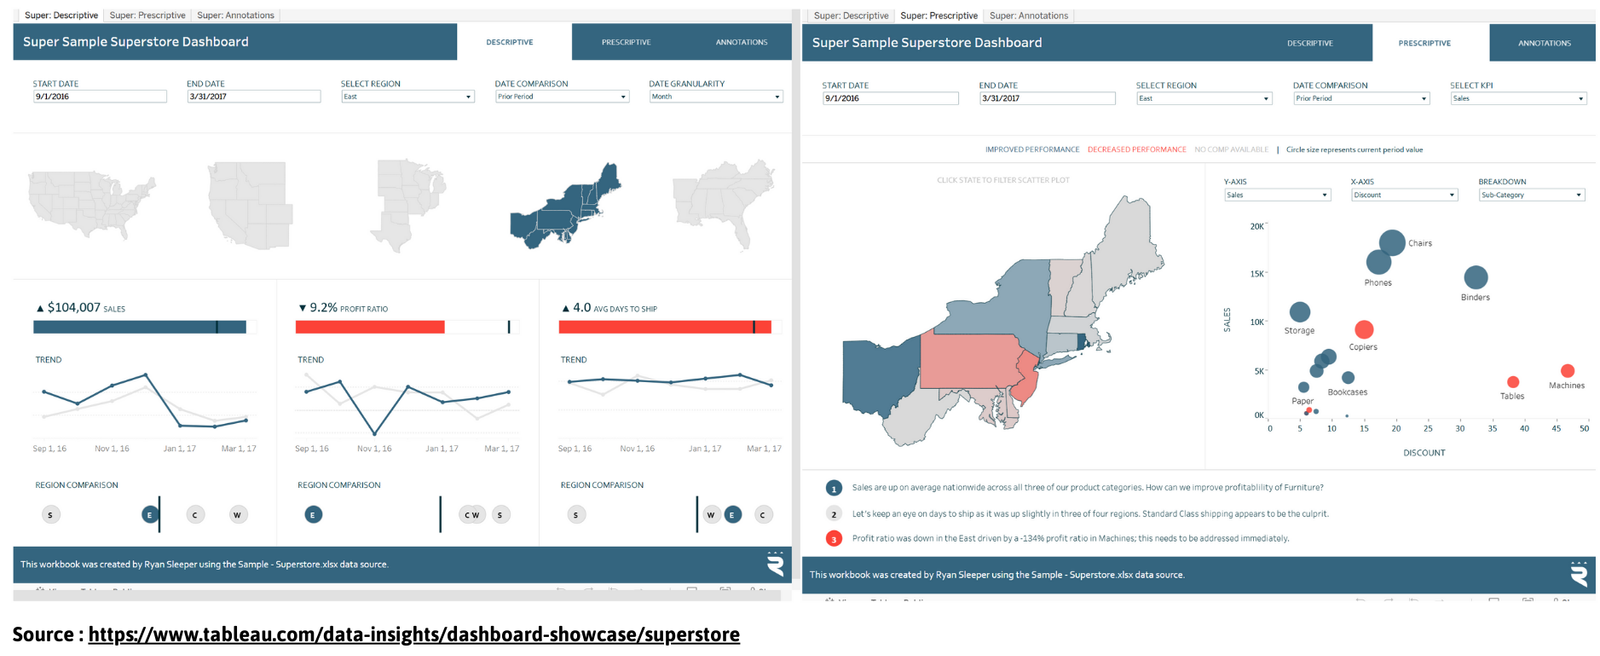
Figure shows the Visualizations which can be Done via Tableau.
2. Drag-and-drop interface: This enables users to quickly build a dashboard by dragging the data fields and visualization elements onto the workspace. For instance, a financial analyst could drag revenue data onto a bar chart to see their yearly earnings side-by-side.

Figure shows the Drag and Drop of Data fields via Tableau.
3. Advanced Analytics: Tableau has robust built-in components for complex calculations along with predictive analytics. For instance, a line of trend can be used to predict future sales based on historical data.
4. Integration with Multiple Data Sources: Tableau connects to multiple data sources, including databases, cloud services, and spreadsheets. For example, merge data from Google Analytics with SQL Server data to analyze site traffic against customer transactions.
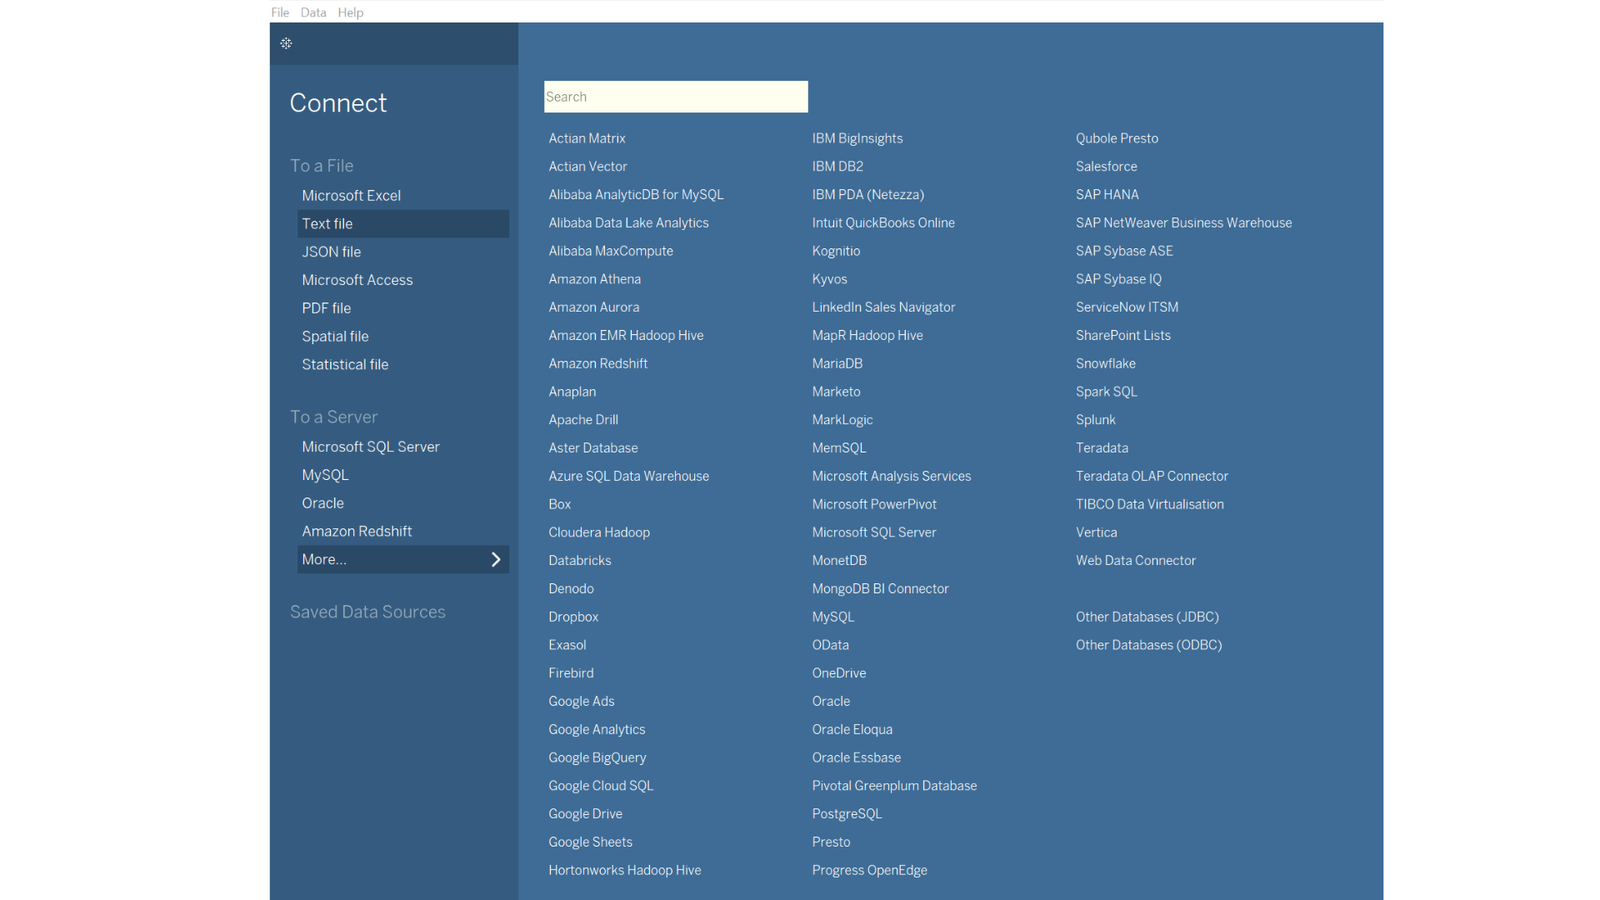
Figure shows the Multiple Data Sources available to connect with Tableau
5. Real-Time Data Analysis: Tableau allows for live connection to data sources and can refresh in real time. Example: Live dashboard monitoring of delivery statuses for a logistics team.
6. Extensive Customization: Tableau is capable of highly customized designs to fit individual needs. Example: Custom design a dashboard with filters to allow users to view data by product category or period.
7. Collaboration and Sharing: Secure sharing via Tableau Server, Online, or Public. For example, team leaders can present an interactive sales report that stakeholders could drill down on to know exactly what metrics they need.
What is Power BI?
Power BI is Microsoft's business intelligence and data visualization tool. It enables users to connect to a variety of sources, transform raw data into meaningful insights, and publish interactive dashboards and reports. With its user-friendly interface and seamlessness in the Microsoft environment, Power BI has become one go-to solution for most companies that want to leverage data to enhance strategic decision-making.
Power BI was initially imagined by Ron George in 2010. It emerged as a development project called Crescent. Crescent aimed at working effectively with SQL Server Reporting Services or SSRS. Three years later, in 2013, the same product, now Power BI, was given to the masses under the mantle of Office 365 from Microsoft. Power BI was first released as a standalone product in July 2015 and had tremendous improvements, including integration with Azure and the desktop-based application. Following that, Power BI was developed with regular updates, including feature improvements such as AI-driven insights and real-time analytics, as well as extensive customization options. The following figure depicts the products of Power BI.
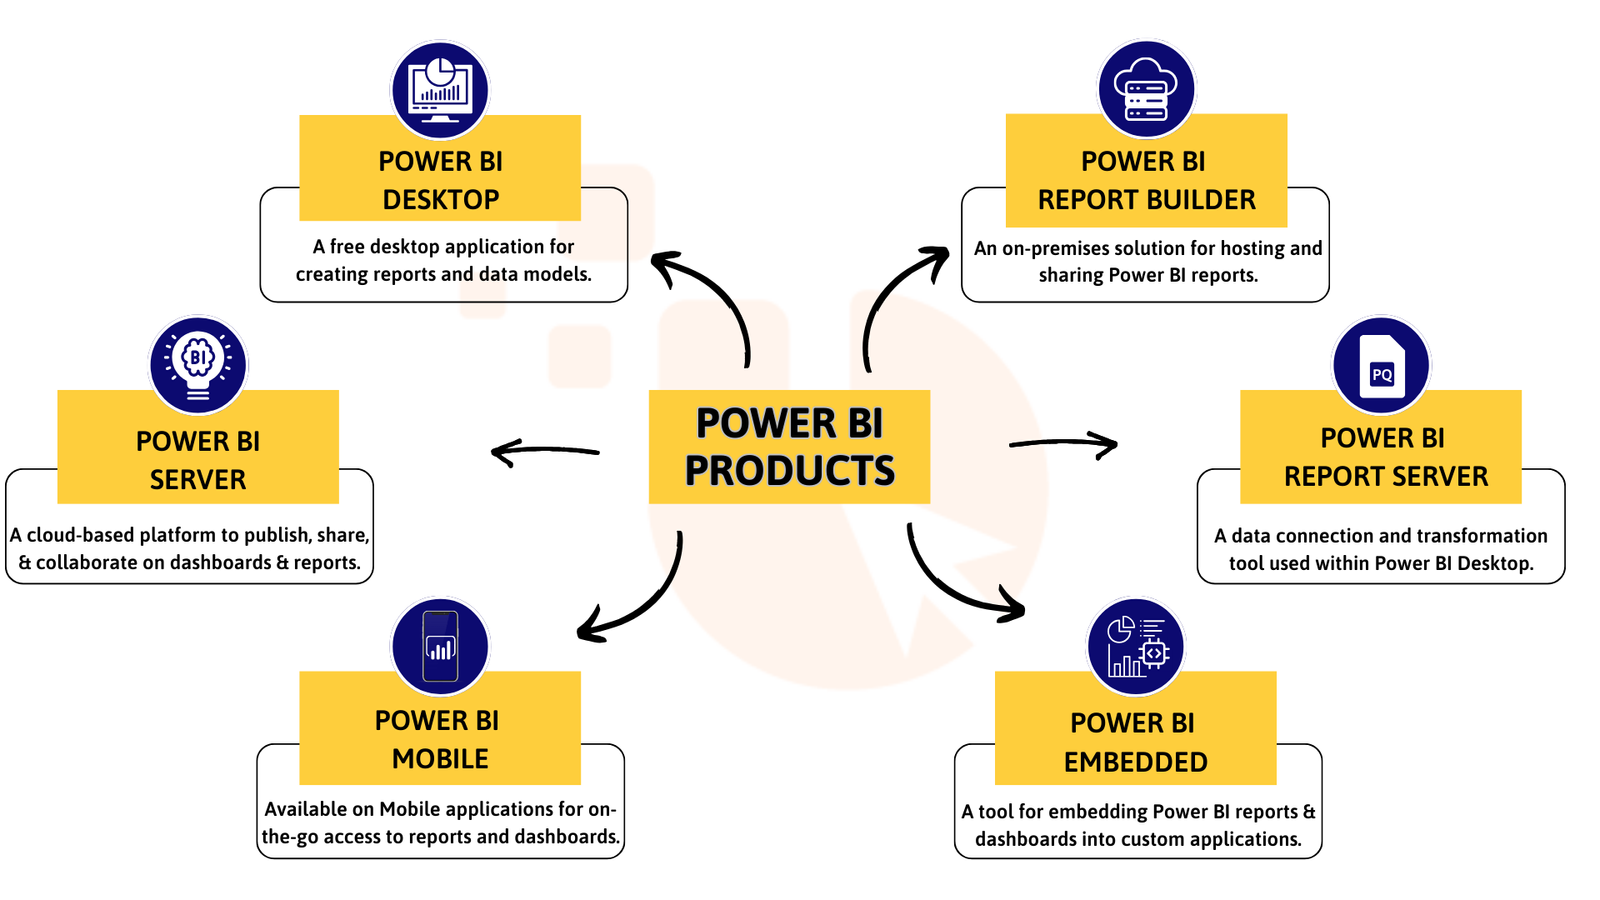
Figure shows the Products of Power BI
Features of Power BI
1. Interactive Dashboards and Visualizations: Power BI lets you create richly visualized dashboards with interactive charts and graphs. Example: A sales manager can create a dashboard to track monthly sales performance across different regions, clicking on a specific region to filter data instantly.
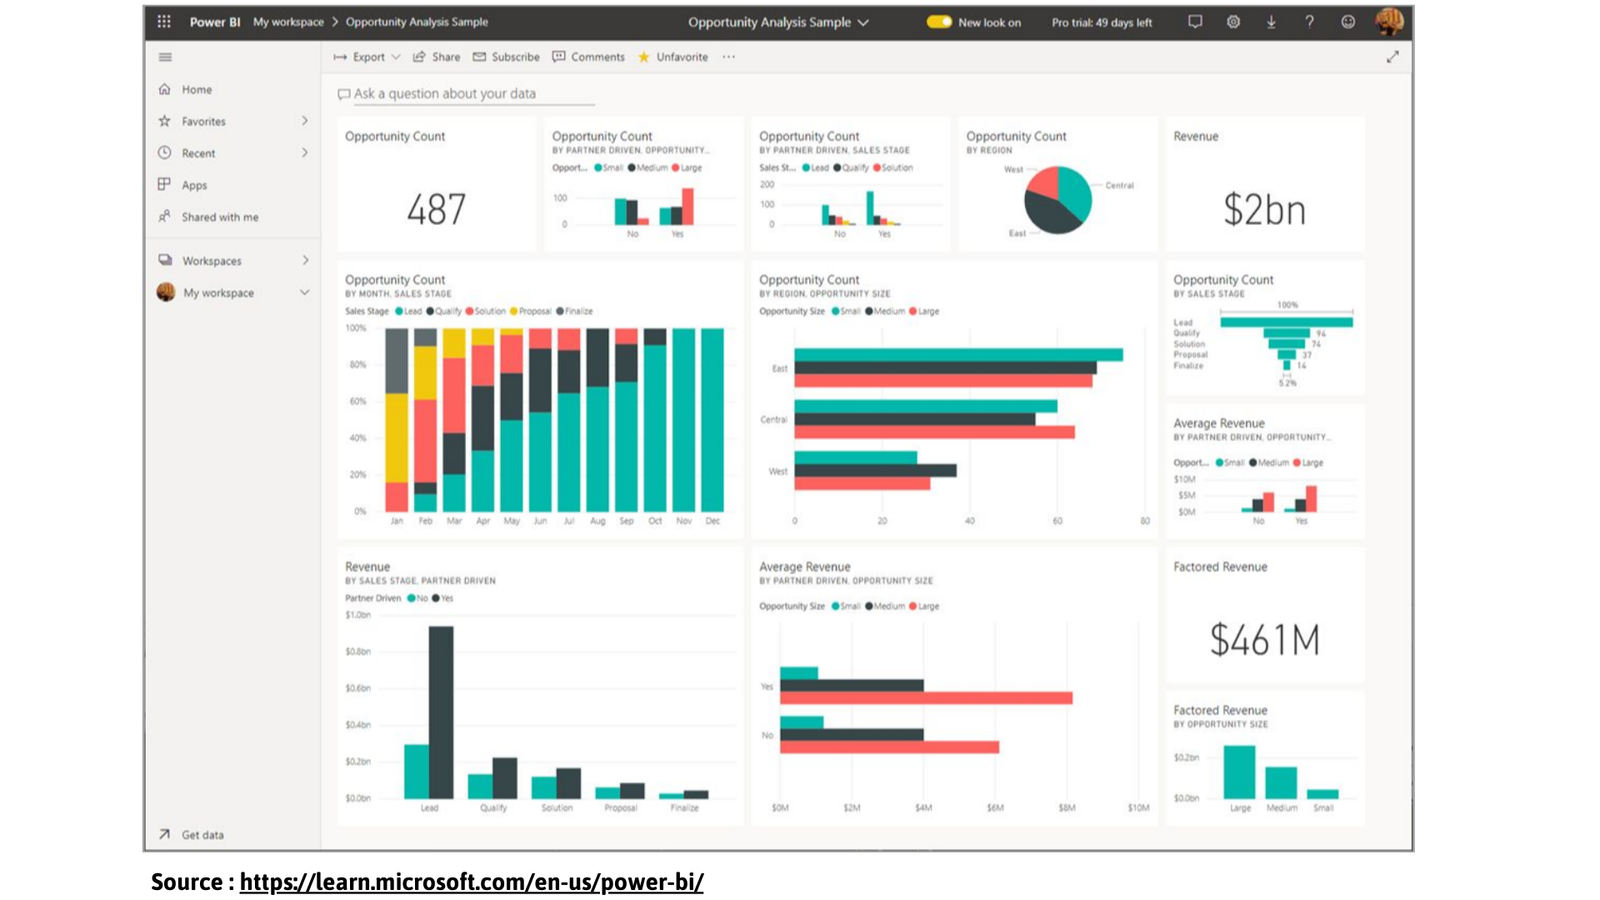
Figure shows the Visualizations Performed via Power BI
2. Seamless Integration: Power BI allows for seamless integration with a vast array of tools and platforms, elevating its functionality and usability across diverse domains, including Microsoft Tools, Third Party Tools and services, Cloud and Big Data Platforms, Project and Productivity Tools. For example, you may ingest data directly from Excel sheets or link up your Dynamics 365 CRM system to understand trends about your customers better.
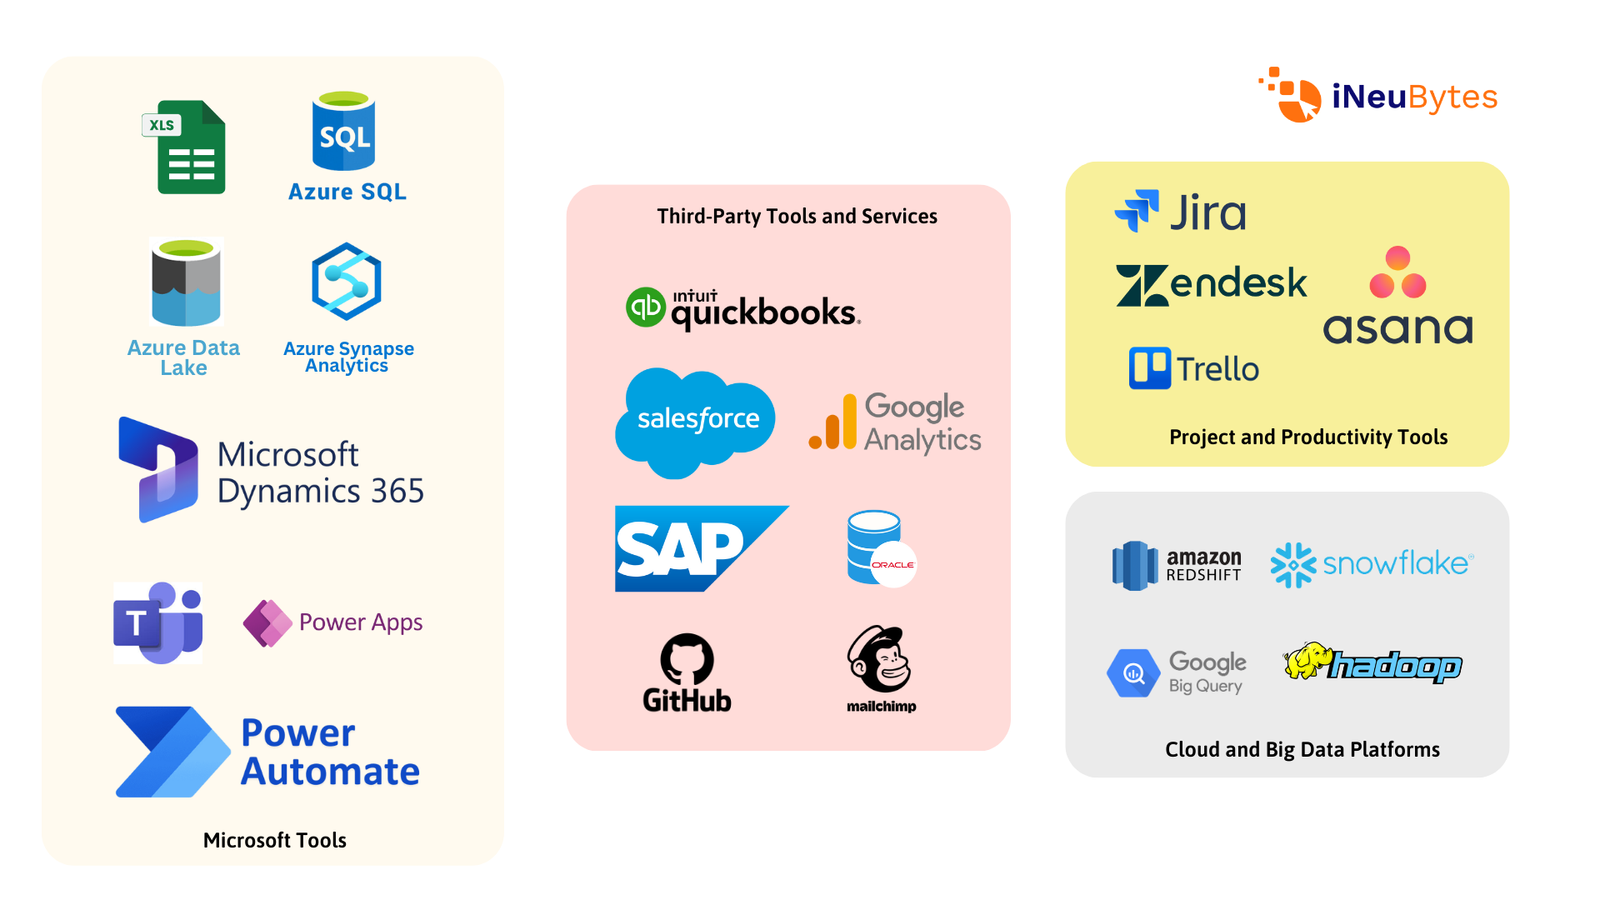
Figure shows the Integrating Tools Which can be Connected to Power BI
3. AI and Natural Language Processing: Power BI comes with AI features that include the Q&A ; A tool, which you can use to type questions in natural language and get visual answers. Example: Typing "What were the total sales by the release year" will generate a graph showing the total sales data for the release year, i.e., performance over the year since their launch.
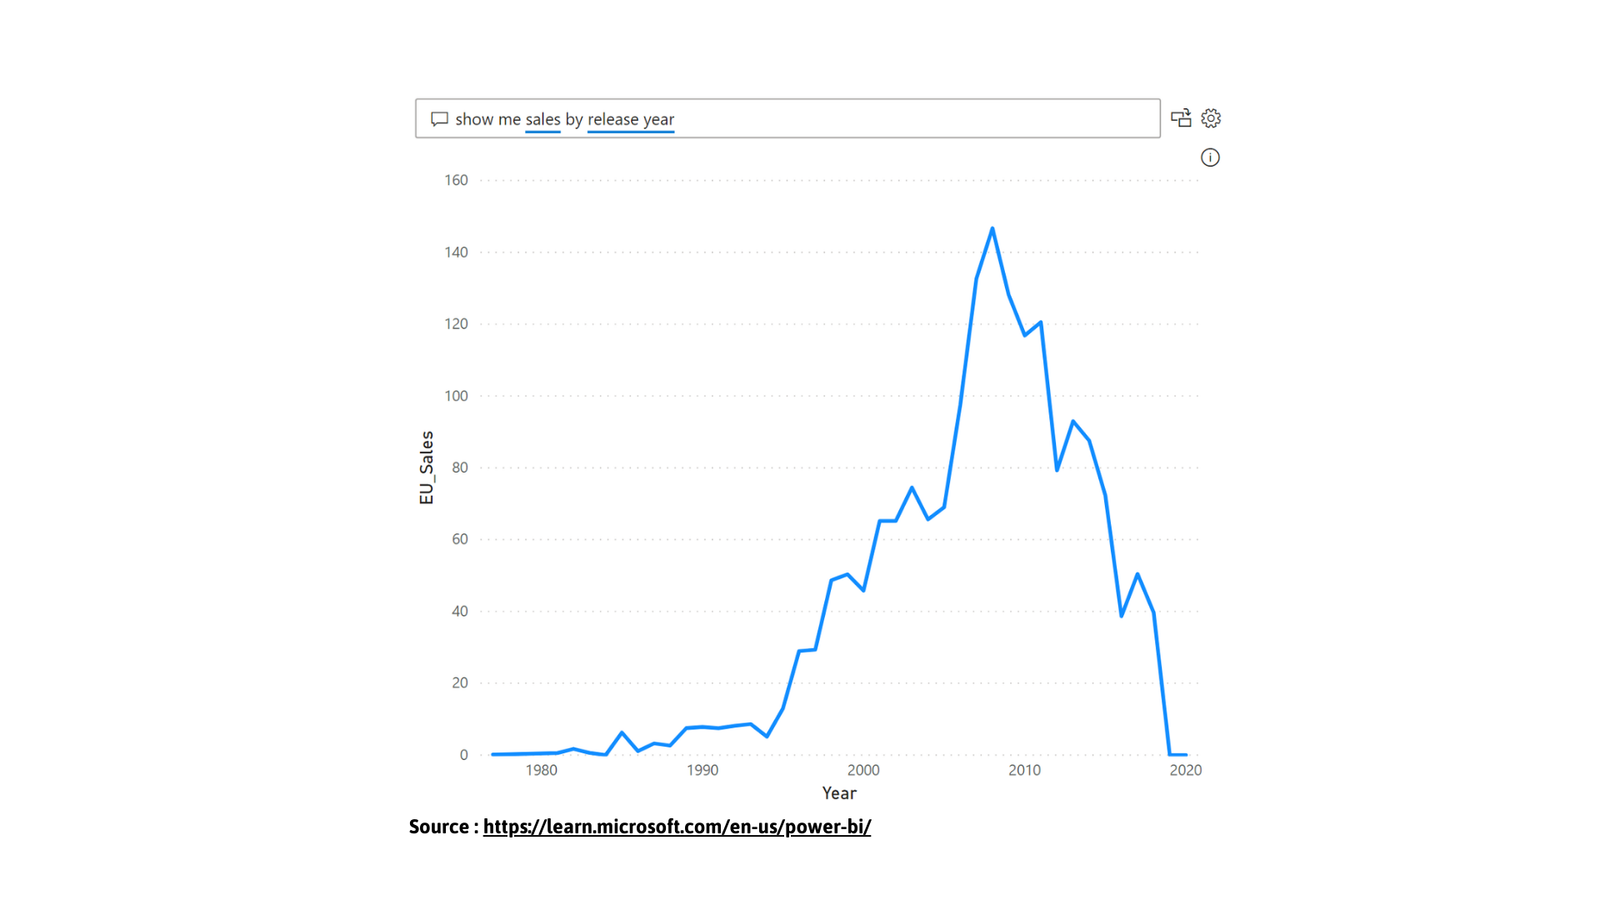
Figure shows the Q/A tool developed with AI for Visualization & Explaination
4. Real-Time Analytics: It can monitor real-time data streams, so it is indeed invaluable for real-time decision-making. Example: A logistics team can track the current status of deliveries and vehicle locations on a live dashboard.
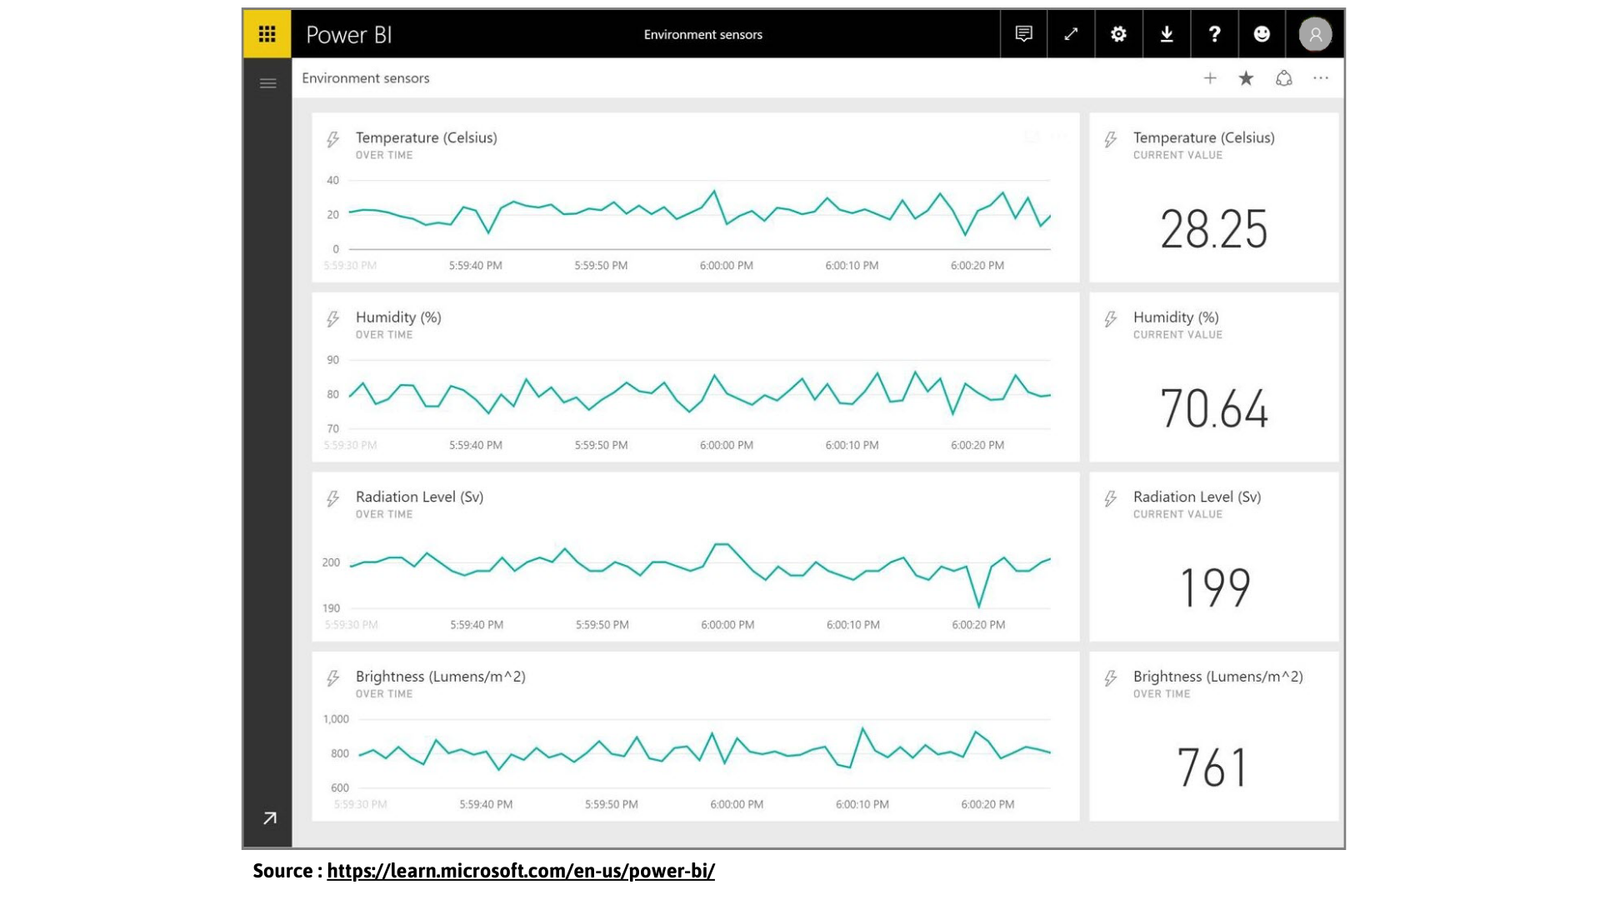
Figure shows the Real Time Visualizations from Input Devices with Power BI
5. Data Connectivity: Power BI provides access to over 100 data sources-from premises-based to cloud-based. Example: A retailer can draw data from their SQL database, Google Analytics, and Salesforce to analyze sales and customer behavior in one place.
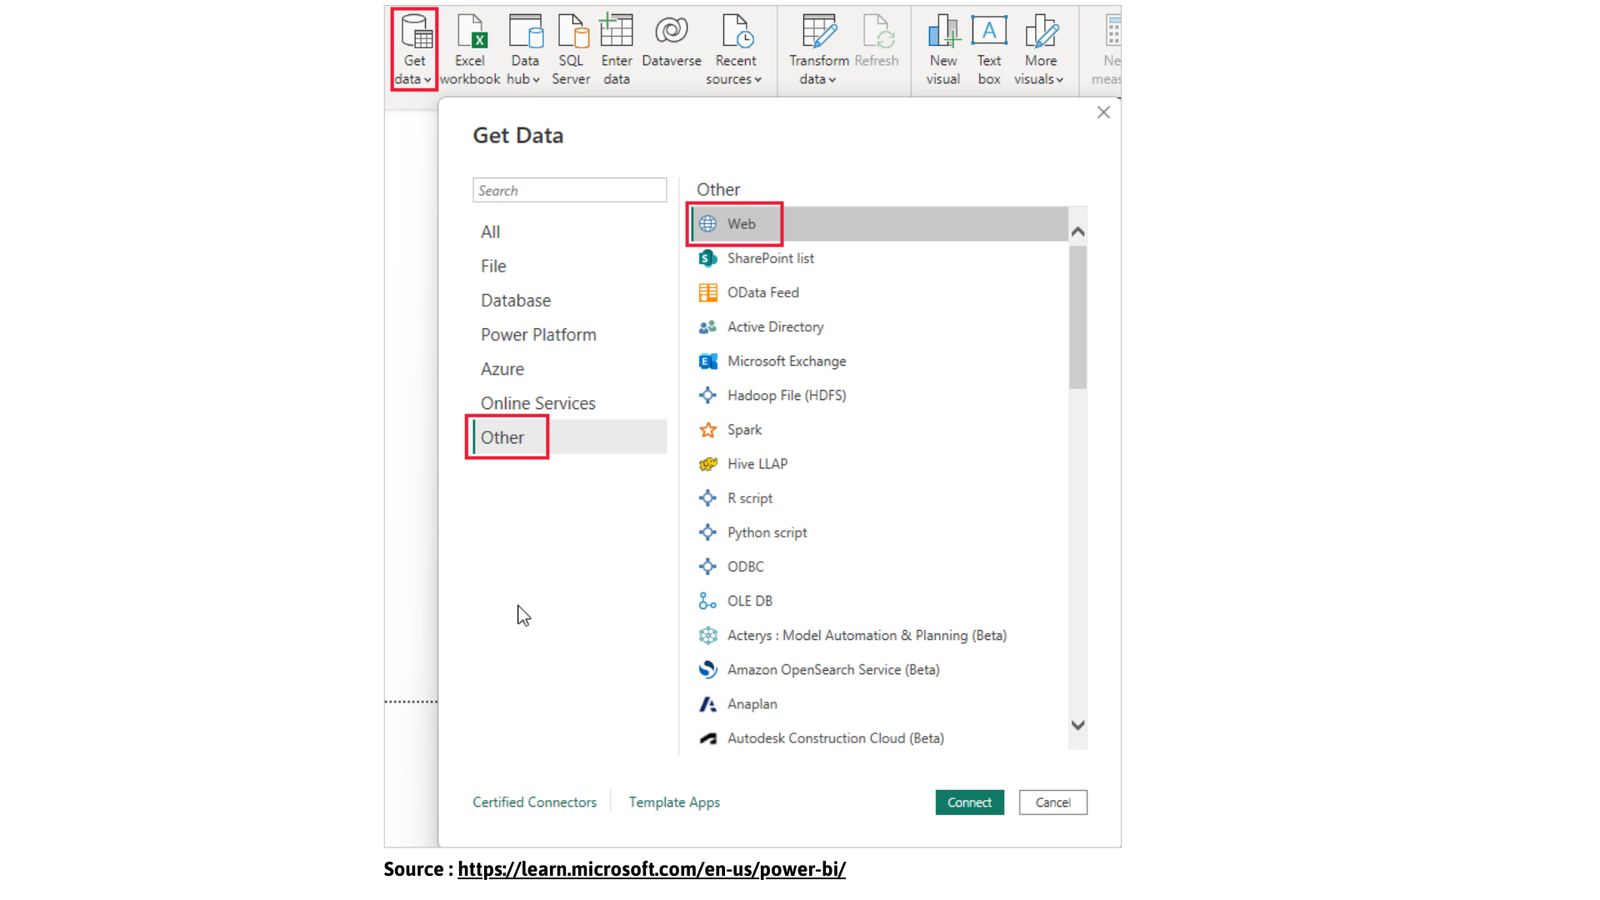
Figure shows the Multiple Data Connections with Power BI
6. Robust Security: Power BI assures that the data is kept safe because access to certain parts of data is only allowed based on role. Example: All the details of the employees would be seen by an HR manager, but a team leader could just see team information.
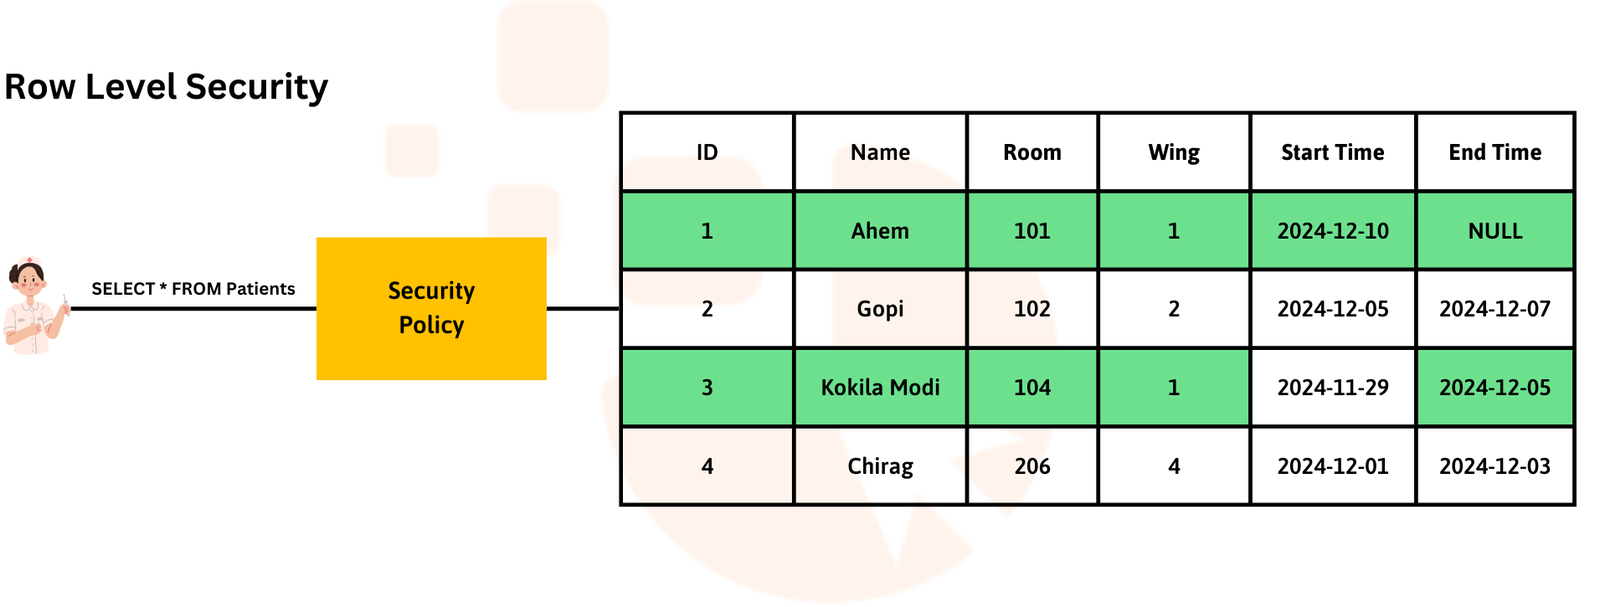
Figure shows the RLS, allowing data roles with Power BI
7. Ease of Use and Customization: Its drag-and-drop interface and custom visuals make it easy and versatile in report creation. Example: A marketing analyst can drag campaign data into a bar chart and add a pie chart to compare campaign effectiveness, customizing colors and labels as needed. The features of Power BI help businesses simplify data analysis and make informed, crystal-clear decisions with ease.

Figure shows the Drag and Drop Interface with Power BI
Tableau and Power BI Comparison of Pricing
Tableau offers its product in two categories, Self-Service Analytics for Teams and Enterprise Edition, to offer plans for users with different roles and requirements. Under the Self-Service Analytics plan, Tableau Creator is $75 per user per month, which is billed annually. The purpose of this plan is for power users who require all of the tools such as Tableau Desktop, Prep Builder, and Tableau Cloud or Server. It supports end-to-end analytics workflows, so it is the ideal suitor for analysts and data teams. The Explorer plan is suited for users who mostly explore trusted data and have specific queries that need to be answered. It costs $42 per user per month when billed annually.
Meanwhile, the Tableau Viewer plan, priced at $15/month/user billed annually, is for users who only need secure access to dashboards and visualizations without other advanced analytical tools. Tableau offers Enterprise Edition plans for businesses that need enterprise-grade data management and analytics at scale. Enterprise Creator offers all the functionality of Tableau Creator but provides enterprise-caliber administrative and data management capabilities for $115 per user per month (billed annually). The Enterprise Explorer plan is sold at $70 per user per month. It includes self-service analytics with advanced management tools. In contrast, the Enterprise Viewer plan, sold at $35 per user per month, focuses on securely interacting with dashboards and visualizations in a performance-optimized platform. The cost mentioned on Tableau's website is shared below.
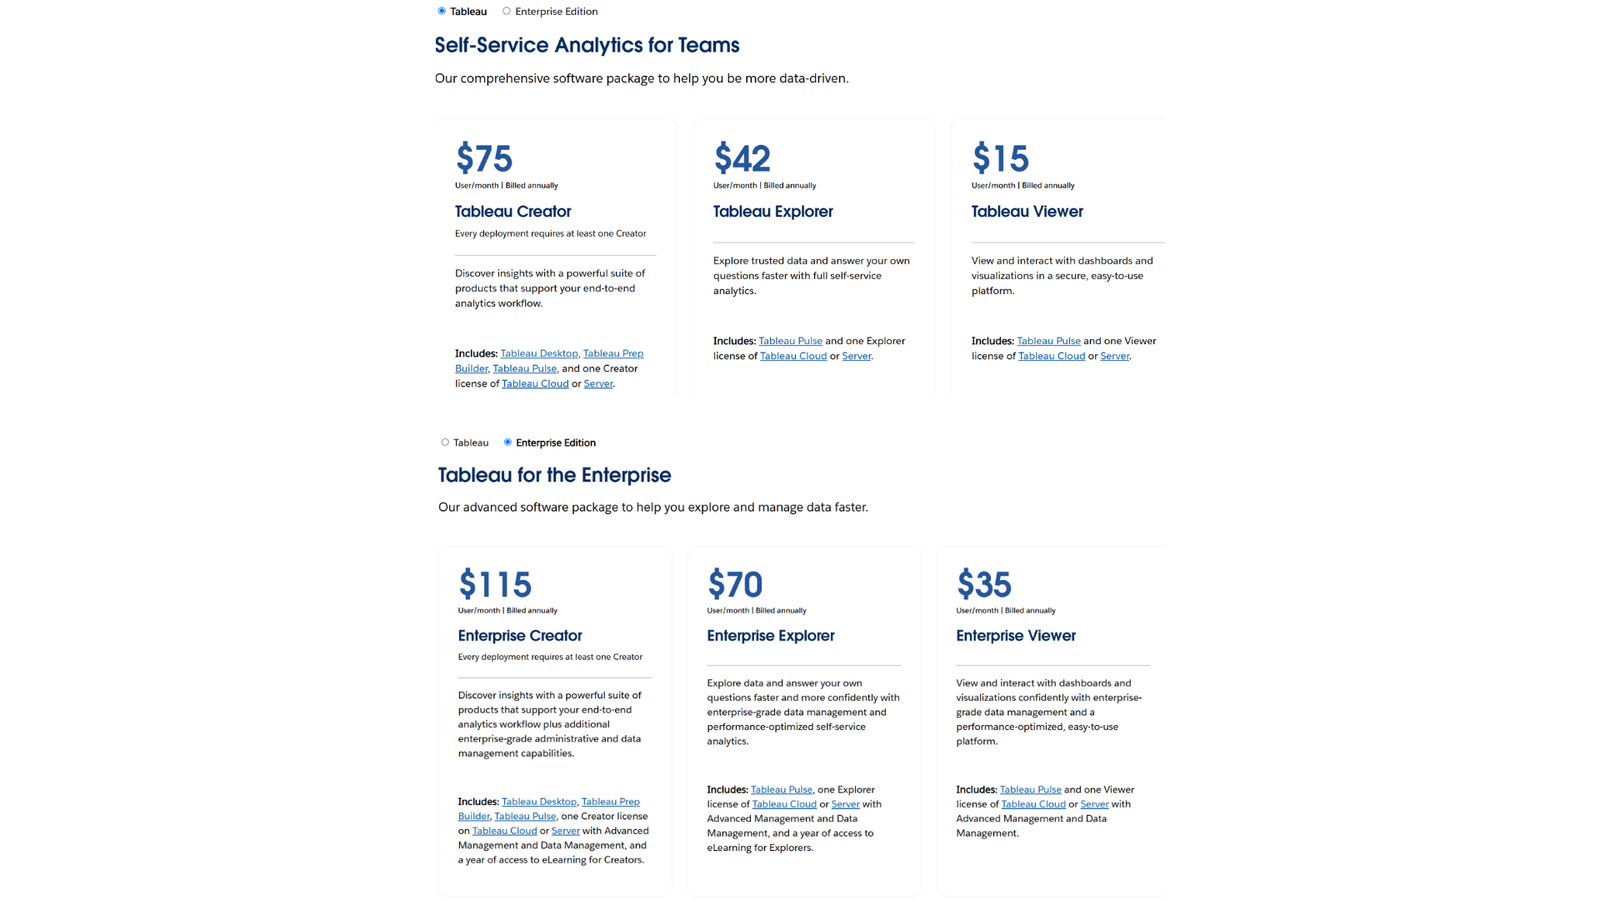
Figure shows the Pricing of Tableau
Power BI offers flexible pricing plans tailored to meet the needs of individuals and organizations. The Free Account allows users to create rich, interactive reports with basic features at no cost. It includes integration with Microsoft Fabric and requires no credit card to sign up. However, users need to upgrade to Power BI Pro or Premium to unlock sharing and collaboration features.
The Power BI Pro plan, costing $10 per user per month, allows users to publish and share reports with their colleagues, thus fostering teamwork and collaboration. It is also included in Microsoft 365 E5 subscriptions, which makes it a cost-effective option for businesses already utilizing the Microsoft ecosystem. If more enormous requirements are needed, more enterprise-scale features are to be found in the Power BI Premium Per User plan, at $20 for every user per month, with larger model sizes as well as more frequent refreshes, assuring easier complex analytics. Developers could prefer to embed Power BI reports into the client-built, specific applications, which have variable pricing depending on their utilization and use within their plans. This plan is best suited for organizations that want branded analytics solutions with automated monitoring and deployment capabilities.
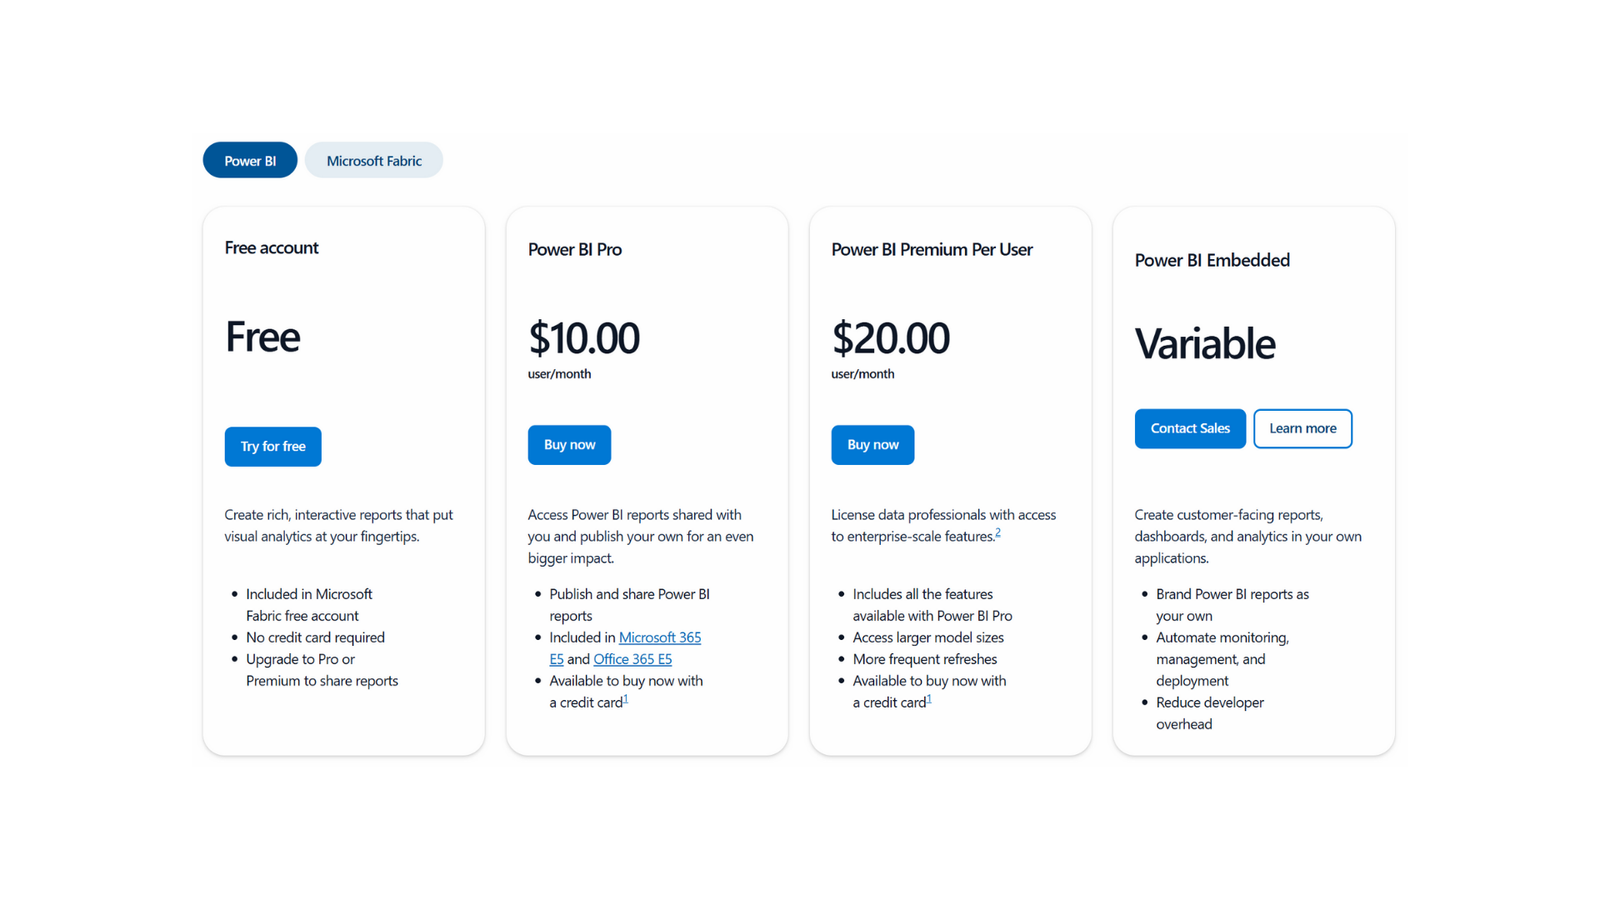
Figure shows the Pricing of Power BI
Tableau & Power BI Differences
Advantages of Tableau:
1. Superb data visualization capabilities: Tableau has received wide and long recognition for its advanced and sophisticated data visualization capabilities. It is possible to create more dynamic and complex visualizations that are aesthetically prettier.
2. Better Handling of Large Data Sets: Tableau handles large data sets well by performing rendering visualizations and processing data in a better way.
3. Flexibility and Extensibility: Tableau offers flexibility related to deployment options and can integrate with a vast number of different data sources and platforms, not limited to a specific ecosystem.
4. Advanced Analytical Tools: These tools have more advanced analytical capabilities for in-depth data analysis, such as forecasting and trend analyses, which are crucial for deep analytical tasks.
Drawbacks of Tableau:
1. Cost Barrier: The cost barrier of Tableau is considerably higher, especially for full functionality on Tableau Desktop, which may be a considerable disadvantage to startups or smaller companies.
2. Steeper Learning Curve: Tableau's interface and a myriad of functionalities can present a steep learning curve for new users, requiring more training time to master, which means more upfront costs in the form of training.
3. Less Integrated with Microsoft Products: Unlike Power BI, Tableau is not as well-integrated with Microsoft products. This may be a drawback for organizations that heavily depend on the Microsoft ecosystem.
4. Resource-Intensive: Tableau can be quite resource-intensive, requiring robust hardware for optimal performance, which could increase the total cost of ownership when deploying enterprise-wide.
Advantages of Power BI:
1. Cost-Effective for SMEs: Power BI is competitively priced and is more accessible for small and medium enterprises that already exist within the Microsoft framework and may even have smaller teams.
2. Simplified data refresh and integration: It has made refreshing and integrating data easier with Microsoft services, which means a significant deal for companies heavily using the products.
3. Familiar Interface for Microsoft Users: For users familiar with Microsoft Office products, with Power BI, they can learn quickly with integration and similarities in the interface, less training time, and less investment in that regard.
4. Growing Community and Support: Because it is free and widely used, Power BI has a rapidly growing community that offers extensive forums, tutorials, and user groups to provide support and suggestions for improvement.
Disadvantages of Power BI:
1. Poor Visualization Customization: Although Power BI offers a good set of visualization options, it is less varied and certainly less advanced than in the case of Tableau.
2. Slow Performance for large datasets: Users reported that Power BI can sometimes become slow or restricted while working with huge datasets or complex data models.
3. Dependence on Microsoft Stack: It is beneficial to be closely integrated with Microsoft products. However, it also creates dependence, making it less flexible if an organization wants to integrate with other non-Microsoft technologies.
4. Less Advanced Geo-Mapping Features: Compared to Tableau, Power BI does not support advanced geo-mapping capabilities, which can be a drawback for organizations that need sophisticated geographical data visualization.
In a nutshell, Tableau and Power BI for Data Analysis are very excellent BI tools that cater to different organizational needs and preferences. For those who are heavily invested in the Microsoft ecosystem and want an economical solution with tight integration and ease of use, Power BI might be the better choice. Tableau is better suited to organizations that need deep customization, highly advanced analytics capabilities, and heavy handling of large datasets, showcasing Tableau's benefits over Power BI, but it comes at a cost. Whether an organization should use Tableau or Power BI would be determined by its business requirements, technical infrastructure, and budget constraints. Each tool has advantages that can help businesses seize the power of data and make informed decisions to gain a competitive advantage in their respective markets.